This morning, a fairly strong earthquake struck southern Mexico - can SAS analyze past earthquake data to help predict future earthquakes?...
I don't have any pictures of earthquake damage, but here's one I took of the main house/prop from the Snow Camp Outdoor Theatre here in North Carolina - I imagine this might be what a lot of rural houses could look like after a strong earthquake!

As usual, the example in this blog post starts with a quest for data - earthquake data, to be specific. Luckily the NOAA's National Geophysical Data Center maintains quite an extensive database of earthquakes around the world. It not only lists the current ones, but even contains estimated data for earthquakes going back several thousand years.
I downloaded the entire database, saved it in a tab-delimited file, and then imported it into SAS using the following code:
PROC IMPORT OUT=quake_data DATAFILE="worldquakes.txt" DBMS=TAB REPLACE; GETNAMES=YES; DATAROW=2; RUN; |
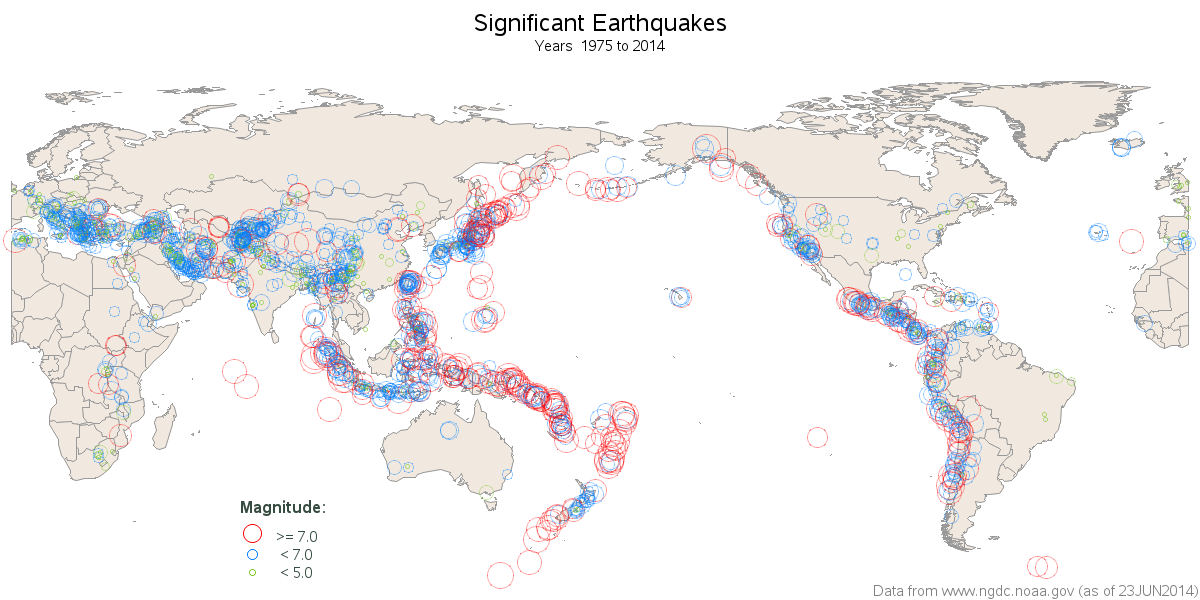
I then annotated markers onto a map at the lat/long locations where earthquakes have occurred, and used the size and color of the markers to represent the magnitude of the earthquakes. Here's the map for all earthquakes since 1975 (click the map to see it in full size):
And here's the map of all the earthquakes in the entire database, going back about 4000 years. Basically, the same regions that have been getting earthquakes the past ~40 years, are the same ones that have been getting earthquakes the past ~4000 years.
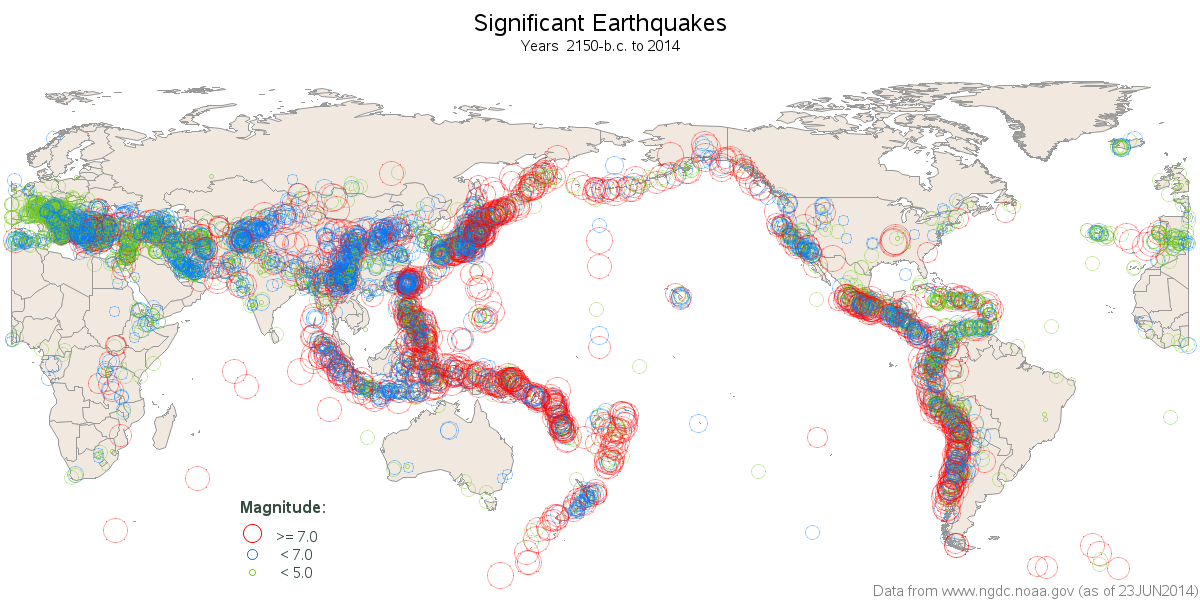 So, based strictly on a visual analysis, you can look at this map, and quickly tell where earthquakes are most likely to occur.
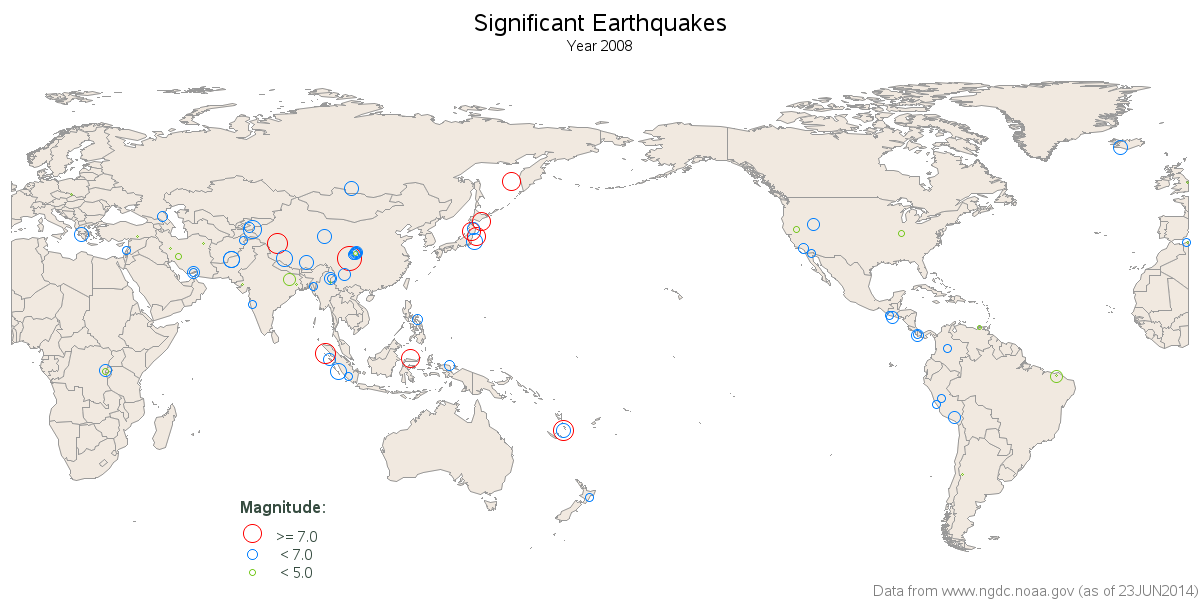
And here's one of my own earthquake theories ... in 2008 China filled the reservoir for the huge Three Gorges Dam. I notice in 2008 there were also a lot of small earthquakes in that area of China (see all the overlapping blue circles in the map below). I think the weight of all that water caused some of the land to 'settle', setting off a few small earthquake tremors. Does anyone know whether or not my dam theory holds water? ;)
Now it's your turn - what theories do you have about predicting earthquakes? Feel free to share your theory in a comment!


5 Comments
Amazing...I was just thinking why in the visualization I feel like all these earthquakes fall along the lines of the crater that caused the "continental drift".
Robert,
You never run out of interesting demonstrations of what you can do with SAS/GRAPH and with that PROC GMAP which I so fondly regard. BTW, in this era of "InfoGraphics", it is interesting to recall my coining the term InfoGeographics for what you can create with PROC GMAP.
Just in the last few days I stumbled across a discussion of "Locational Analytics".
Regards,
LeRoy
LeRoy Bessler PhD
Bessler Consulting and Research
Visual Data Insights™
Thanks LeRoy!
Guatemalan's hold a theory that a big earthquake (7.0 or more) strikes every 50 years. Look at this data (you probably have better but this is what I have):
http://en.wikipedia.org/wiki/List_of_earthquakes_in_Guatemala.
Interesting!